Overview
ZeroGuard is an Enterprise Pre-Flight Simulator for visual data pipelines. The user drags stages onto a React Flow canvas; ZeroGuard compiles the visual flow into SQL, runs the planner against a live Postgres backend, and walks the DAG to catch policy violations and Cartesian-product blow-ups before the pipeline is deployed.
Visual editor
React Flow + a transform-flow-ui library for stage editing, drag-drop, undo/redo, and per-node popovers.
Static analysis
Lineage traversal and graph-shape detectors run entirely from the pipeline JSON — no DB call required.
Live planner
The compiled pipeline runs through EXPLAIN (FORMAT JSON) against your chosen backend — Aurora PostgreSQL in production, local Postgres for dev iteration.
One-click remediation
Auto-Fix Compliance inserts a hashing stage upstream of any PII leak and rewires the canvas in place.
Scope: what ZeroGuard does NOT do
ZeroGuard is a read-only transformation designer and pre-flight estimator. Source tables are provisioned and maintained by Aurora PostgreSQL (or local Postgres for dev). The app reads metadata via information_schema and runs EXPLAIN against them — it does notupload, create, modify, or delete data. The LOAD stage's "Source table" picker lists tables already present in the cluster.
Architecture
Three layers, one wire format (Postgres SQL). The browser owns pipeline state; the API routes own analysis + EXPLAIN; the database owns the planner.
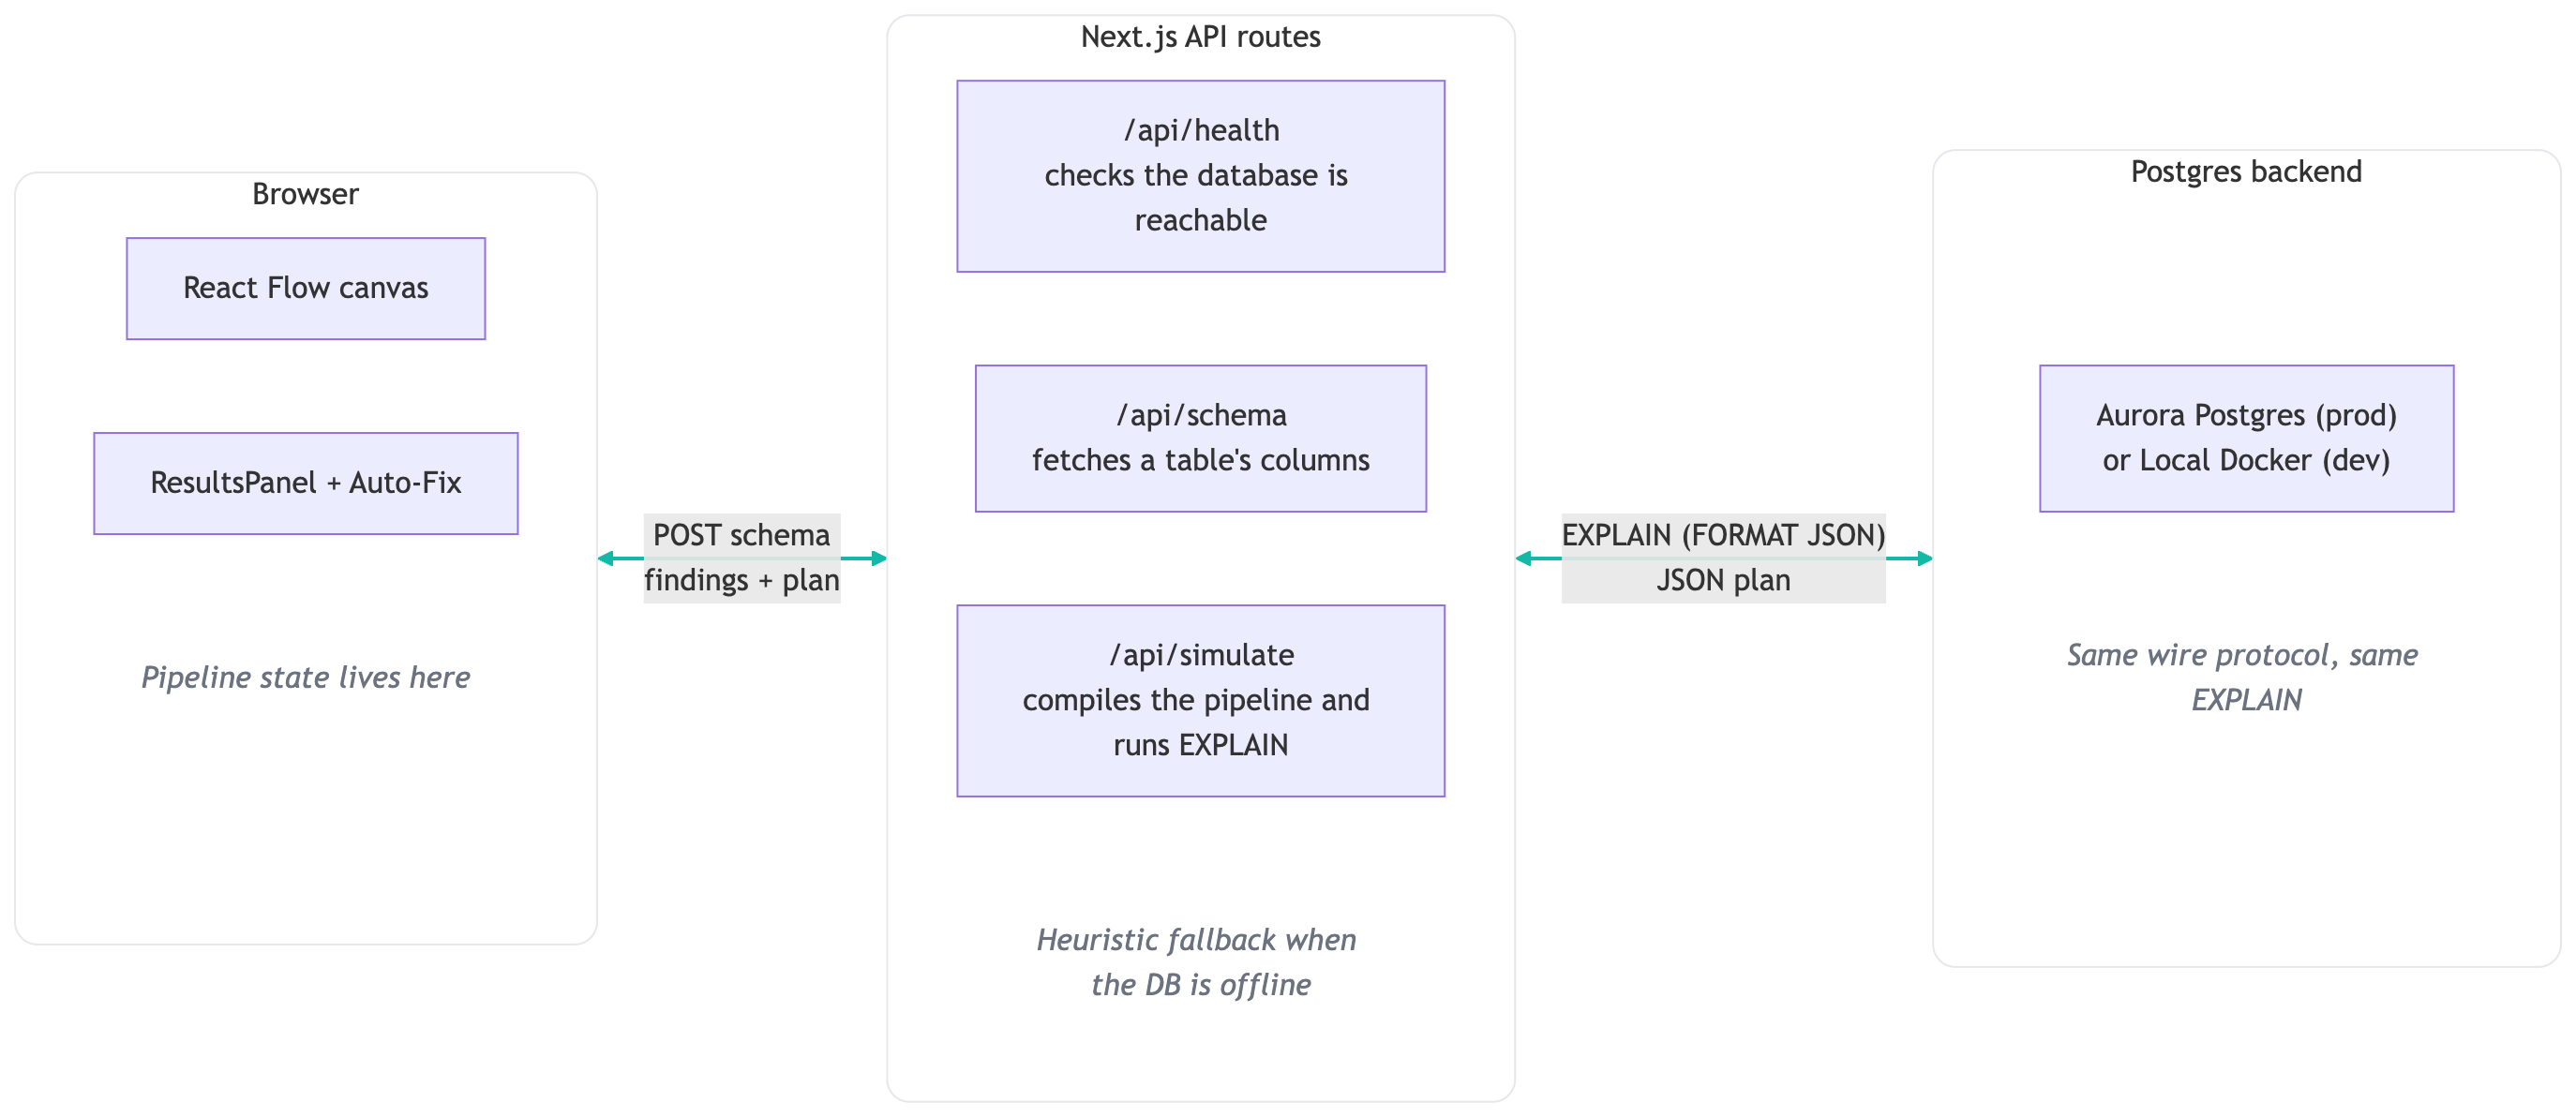
Browser
React Flow canvas + ResultsPanel + Auto-Fix. Pipeline state lives in React; Auto-Fix is a client-side schema mutation, no round-trip.
API routes
3 Next.js route handlers: /api/health, /api/schema, /api/simulate. Compile pipeline JSON → CTE chain → EXPLAIN. PII traversal runs here too.
Postgres backend
Aurora PostgreSQL for the deployed product (H0 Hackathon submission). Local Docker Postgres for dev. Same wire protocol, same EXPLAIN output — lib/db/index.ts picks one based on env vars.
Guardrails
The shipped checks are listed below — three concrete examples of a more general framework. Each one is implemented in app/api/simulate/route.ts as a function over the pipeline JSON; adding new checks means adding a new function and emitting findings with an attribution stageId.
Anything expressible as a property of the DAG, the compiled SQL, or the EXPLAIN plan tree can become a guardrail. Examples we haven't shipped yet but the framework would support: unbounded ORDER BY, missing indexes (via pg_stats), cross-region data movement, additional PII column patterns, per-stage row-explosion thresholds, missing JOIN broadcast hints.
PII lineage
criticalWalks the DAG from every terminal stage back to its sources. Any column matching email / phone / ssn / credit_card (substring match, case-insensitive) that reaches the terminal without (a) being hashed by an upstream CUSTOM/FORMULA stage or (b) being dropped via SELECT triggers a critical 'COMPLIANCE BREACH' finding. The terminal stage's node glows red on the canvas.
Cartesian join
criticalAny JOIN with a blank leftKey or rightKey is flagged critical. The EXPLAIN call is intentionally skipped (a real planner against a 50B-row cross product either refuses or hangs); cost metrics are pinned to representative disaster values.
Full-scan + shuffle
warningLOAD without any downstream FILTER produces a warning attributed to the LOAD node. Any keyed JOIN (whose tables aren't co-located) emits a shuffle warning attributed to that JOIN. Both light up amber.
How to add a guardrail
- Write a function in
app/api/simulate/route.tsthat takes thePipelineSchema(plus optionally the EXPLAIN plan tree) and returns a list ofSimulationFinding. - Set each finding's
stageIdto the offending stage so the canvas heatmap lights it up automatically. - Push the findings into the existing
security.findingsorperformance.findingsarrays. The score is auto-derived from severity counts.
Cost model
Every dollar value is an estimate. Postgres does not return prices — only row counts and abstract planner units. ZeroGuard multiplies the row count by a fixed $/row rate to produce the displayed dollar amount. Three paths can drive that row count:
Live EXPLAIN (FORMAT JSON)
When: DB reachable AND referenced tables exist.
The pipeline compiles to a single CTE chain (WITH "stage1" AS (...), "stage2" AS (...) SELECT * FROM "terminal"), then EXPLAIN (FORMAT JSON) runs against the live pool.
scannedRows = plan.Plan["Plan Rows"]
costUpper   = plan.Plan["Total Cost"]      // planner units, not USD

compute     = (rows / 600,000 / 4 ACUs)   // wall-clock seconds
              × ($0.12/3600) × 4 ACUs     // $/sec × ACUs

io          = (rows × 0.01 / 1,000,000)   // millions of I/Os
              × $0.20                      // $/M-I/Os

USD         = compute + io
              // ≈ $0.002 per million rows on the OLAP profile
              // 0.01 I/Os/row, 600K rows/s/ACU = empirical, tunable
              // $0.12/ACU-hr, $0.20/M-I/O = real Aurora Std rates
The verbatim Postgres response is returned as rawExplainJSON and surfaced in the "🔍 Postgres EXPLAIN plan" disclosure at the bottom of the result panel.
Heuristic fallback
When: DB offline, table missing, or compile failure.
Falls back to graph-shape estimation — no DB needed; pre-flight never fails.
scannedRows = 10_000_000
              × 0.1^filterCount       // each filter reduces 10×
              × 1.4^joinCount         // each join amplifies 1.4×
USD         = same formula as Path A
The base of 10M rows models "a typical source table." Numbers are rules of thumb, not measurements.
Cartesian short-circuit
When: A JOIN has blank leftKey or rightKey.
EXPLAIN is intentionally skipped (the planner would refuse or hang). Numbers pinned to demo values that match the disaster narrative:
scannedRows = 50_000_000_000     // 1M × 50M cross product
compute     = 5h × 16 ACUs × $0.12 = $9.60
io          = 50B × 0.5 I/Os × $0.20/M = $5,000
                                  // 0.5 I/Os/row models hash spilling
USD         = $5,000              // I/O term dominates
runtime     = 5h
On Aurora Postgres Standardconfig, a cartesian product's I/O term dwarfs the ACU-hours. On I/O-Optimizedconfig the I/O is free but ACU rates are 30% higher — the same query bills closer to $15. The demo uses Standard because it's the more common default and the more dramatic disaster.
What Postgres gives us, what it doesn't
| EXPLAIN field | Used as |
|---|---|
| Plan Rows | estimatedCostRows + the dollar input |
| Total Cost | "Planner cost upper bound" metric (arbitrary units) |
| Node Type, CTE Name | costlyNodeId for the heatmap |
| (none) | Dollar amount — Postgres does not know your billing rate |
| (none) | Wall-clock seconds — planner cost ≠ runtime |
AWS pricing inputs
The dollar rates are real, pulled from aws.amazon.com/rds/aurora/pricing (Aurora PostgreSQL Serverless v2, Standard, us-east-1):
Compute:    $0.12 per ACU-hour
I/O:        $0.20 per 1,000,000 I/O ops
Storage:    $0.10 / GB-month       (not in per-query cost)
Free tier:  Aurora free tier credits for 12 months
            (up to 4 ACUs + 1 GiB storage on small clusters)
The estimatepart is the four empirical knobs — throughput per ACU, ACUs in use, I/Os per row, and the cartesian I/O blow-up factor. AWS doesn't publish formulas for these; they depend on plan shape, cache hit rate, and concurrency. We default to a typical-OLAP profile: 600K rows/s per ACU, 4 ACUs, 0.01 I/Os per row. Real workloads can be 10× off in either direction — calibrate via AWS Performance Insights (record ACU-seconds + I/O ops for a representative query, divide by rows). Edit the four knobs in lib/zeroguard/cost-model.ts.
APIs
Three Next.js route handlers, all built locally. The deployed backend is Aurora PostgreSQL (Serverless v2); every database call uses Drizzle's db.execute(sql`...`) over a standard pg.Pool, so the same code paths also work against local Docker Postgres or — with a different env var — Aurora DSQL.
/api/healthReachability probe. Used by the connection-status pill in the workspace top nav.
Response 200, always:
{
  backend:    "aurora-dsql"     // env var AURORA_DSQL_CLUSTER_ENDPOINT set
            | "aurora-postgres" // DATABASE_URL points at *.rds.amazonaws.com
            | "remote-postgres" // DATABASE_URL points elsewhere (non-loopback)
            | "local-postgres", // DATABASE_URL on localhost / Docker
  reachable:  boolean,
  error?:     string   // unwrapped pg error code on failure
                        // (e.g. "ECONNREFUSED", "28P01")
}
Times out at 1.5s. Never throws; returns 200 with reachable=false if the probe fails so the UI can render a meaningful state.
/api/schema?table=<name>&schema=<public>Column lookup against information_schema.columns. Used to populate a LOAD stage's dataset from the real DB.
Response:
{
  table:    string,
  schema:   string,        // default "public"
  columns:  Array<{
    name: string,
    type: "integer" | "float" | "string"
        | "boolean" | "date" | "timestamp"
        | "unknown",
  }>,
  backend:  "aurora-postgres" | "aurora-dsql"
          | "remote-postgres" | "local-postgres",
  error?:   string,        // when the DB probe fails
}
Table/schema names validated by ^[A-Za-z_][A-Za-z0-9_]{0,62}$ before reaching SQL. Returns 400 on invalid identifiers. On DB failure returns 200 with empty columns + an error field — the canvas renders an empty dataset and surfaces the cause.
/api/simulateThe pre-flight pipeline analysis. Compiles your stage DAG to a CTE chain, runs EXPLAIN against the live DB (or falls back to a heuristic), runs PII lineage traversal, returns findings + denormalized headline facts.
Request:
{ schema: PipelineSchema }

Response:
{
  security: {
    score:    0..100,
    findings: SimulationFinding[],
  },
  performance: {
    findings: SimulationFinding[],
    metrics:  Array<{ label, value, hint? }>,
  },
  // Headline facts for the UI to branch on:
  isPIILeaked:        boolean,
  leakedNodeId:       string | null,
  leakedColumns:      string[],
  estimatedCostRows:  number,
  costlyNodeId:       string | null,
  rawExplainJSON:     unknown,   // null when EXPLAIN unavailable
}

SimulationFinding:
{
  id:       string,
  severity: "critical" | "warning" | "ok",
  title:    string,
  detail:   string,
  stageId?: string,   // drives the heatmap ring on the canvas
}
Always returns 200. The simulate route never propagates DB errors as 5xx — failures land in the heuristic fallback path with an explain-fallback warning finding. leakedColumns drives Auto-Fix Compliance — it tells the client which columns to hash in the inserted CUSTOM stage.
Underlying SQL primitives
Everything below is standard Postgres — portable across local installs, Aurora PostgreSQL, and Aurora DSQL with no code change:
- •
SELECT 1— health probe - •
information_schema.columns— ISO SQL view - •
EXPLAIN (FORMAT JSON) ...— Postgres feature since v9.0 - •
WITH cte AS (...) SELECT ...— standard SQL CTEs
For Aurora PostgreSQL (the deployed backend), ZeroGuard uses a standard new Pool({ connectionString: DATABASE_URL }) from pg — no AWS-specific code runs. The IAM-token signer is only loaded if you take the alternative DSQL path (env var AURORA_DSQL_CLUSTER_ENDPOINT).
Setup
For the H0 Hackathon submission, ZeroGuard runs against AWS Aurora PostgreSQL (Serverless v2) — that's the deployed backend and the cost model is calibrated for it. Local Docker Postgres is supported as a fast dev-iteration loop. Aurora DSQL is also supported but uses a different cost basis.
Production / Submission — Aurora PostgreSQL
Provision the cluster
Create an Aurora PostgreSQL Serverless v2 cluster in the AWS Console (or via CloudFormation/Terraform). Note the writer endpoint — shape <name>.cluster-<id>.<region>.rds.amazonaws.com. Allow inbound 5432 from your IP.
Point ZeroGuard at it
Put the full connection string in .env.local as DATABASE_URL (include ?sslmode=require). lib/db/index.ts detects the .rds.amazonaws.com hostname and labels the pill 'Aurora Postgres'. No IAM token signing — Aurora Postgres uses password auth.
Seed the demo tables
Stream samples/customers.csv + samples/orders.csv into Aurora via `psql $DATABASE_URL -c '\\COPY ...'`. Full DDL + commands in docs/AURORA_POSTGRES_SETUP.md § 2.
Verify
curl /api/health should return backend=aurora-postgres, reachable=true. Open the workspace, load Revenue by region, hit Pre-Flight — the EXPLAIN plan disclosure populates with the real Aurora plan.
Dev iteration — Local Docker Postgres
One container
docker run --name zeroguard-db -e POSTGRES_PASSWORD=postgres -p 5432:5432 -d postgres:16. Default DATABASE_URL already points here. The pill labels 'Local Postgres'.
Seed demo tables
Same CSV recipe as Aurora, but via docker exec -i zeroguard-db psql -U postgres + \\COPY. Or use generate_series for synthetic data. Both blocks in docs/LOCAL_DEV.md § 6.
Disaster demos
Two bundled samples in the Samples menu: Cartesian join (cost disaster) and PII leak (compliance disaster). Run Pre-Flight Check to see the heatmap glow + the Auto-Fix Compliance button appear.
Alternative — Aurora DSQL
DSQL is a separate AWS product
Aurora DSQL is a distributed-SQL service with the same wire protocol but IAM-signed tokens and per-DPU billing (instead of per-ACU-hour). Setup uses AURORA_DSQL_CLUSTER_ENDPOINT + AWS_REGION; see docs/AURORA_DSQL_SETUP.md. The pill labels 'Aurora DSQL'. The current cost model is NOT calibrated for DSQL rates — swap cost-model.ts if you go this route.
Full setup walkthroughs (cluster provisioning, IAM policy details, CSV loading recipes with IAM-token regeneration, disaster-table seed SQL) live in the repository under docs/.